Catawissa, PA 17820 Real Estate Market Pulse | June 2026
Catawissa, PA 17820 Real Estate Market Pulse | June 2026
The most telling detail from Catawissa’s June 2026 market data is not the sale price or the inventory level on its own. It is what happens when you look at both together. With only 1.67 months of supply and a median sale price that climbed 4.6 percent over the prior period, this small Columbia County borough is displaying the classic combination of constrained inventory and upward price pressure that defines a firmly seller-controlled market. Buyers are working with limited choices, and sellers are benefiting from it.
That context matters because Catawissa does not always generate the same level of market conversation as larger regional centers like Bloomsburg or Sunbury. But the numbers here are worth paying attention to, and they tell a clear story about what is happening at the local level in this part of the Susquehanna Valley.
What the Current Data Reveals
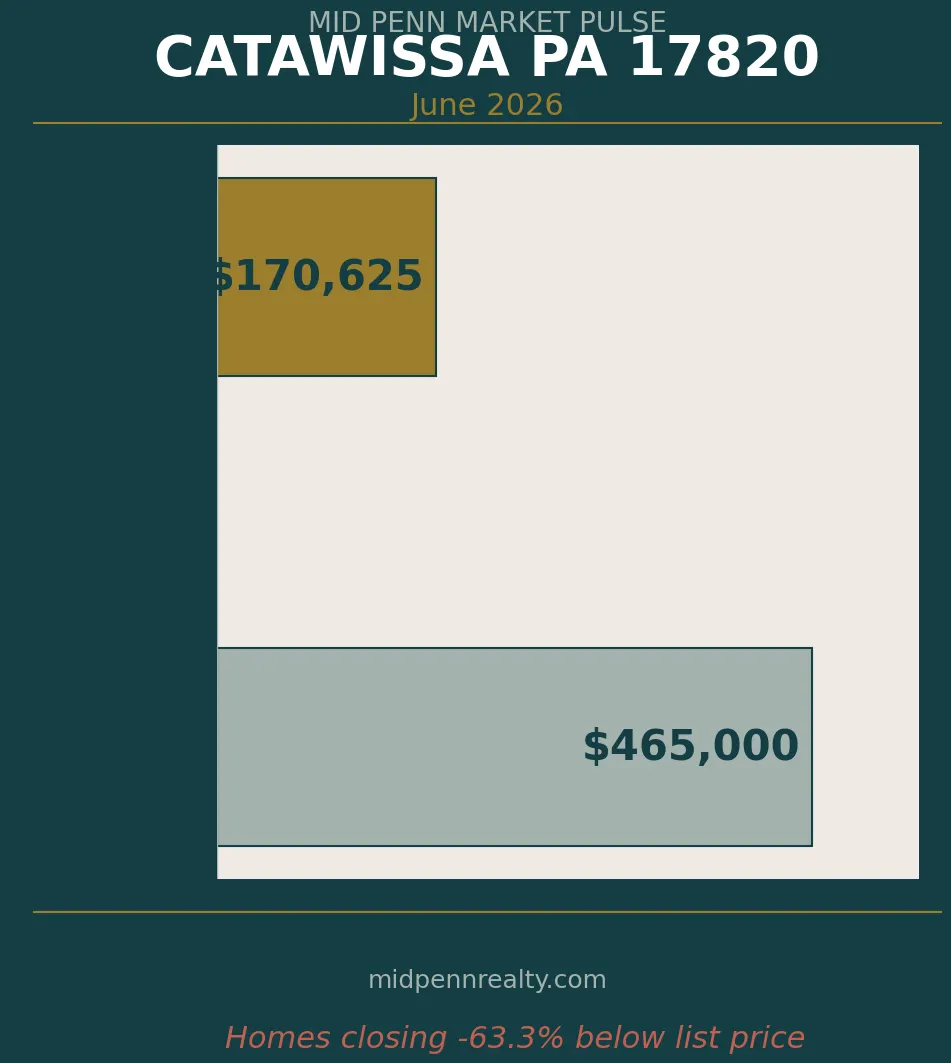
The median sale price in Catawissa for June 2026 came in at $170,625. That figure reflects the actual price at which homes are changing hands, and for a borough like Catawissa, with its mix of older Victorian-era housing stock, more modestly priced ranches and colonials, and some rural properties just outside the borough limits, that number represents genuine, completed transactions.
The more striking figure, and one that deserves careful interpretation, is the median list price of $465,000. At first glance, that gap between list and sale price may seem jarring. A gap of that size almost always reflects the presence of a small number of higher-priced listings pulling the median list price upward, while the properties actually closing are doing so in a more modest price range. This is a common pattern in smaller markets with low transaction volume, where a few premium or larger rural properties can significantly skew asking price data without necessarily reflecting where most buyers and sellers are transacting.
In practical terms, it means buyers should not interpret the $465,000 list price figure as representing the cost of a typical home in Catawissa. Most of what is closing is considerably more accessible than that. But it also means that sellers of mid-range properties need to price carefully and honestly, because the actual sales data is anchoring buyer expectations closer to that $170,625 range, not the upper end of the active listing pool.
The 1.67 months of supply is perhaps the single most important number in this report. A market in equilibrium, where neither buyers nor sellers hold a significant advantage, typically operates with somewhere between four and six months of supply. At 1.67 months, Catawissa is running at well below half of what most real estate professionals would consider a balanced market. That level of inventory scarcity keeps upward pressure on pricing, reduces the time homes spend on the market before going under contract, and limits the options available to buyers who are actively searching.
The 4.6 percent price increase over the prior period reinforces that supply and demand dynamic. Prices do not generally move upward at that pace without a reason. In this case, the reason appears to be straightforward: there are more buyers willing to transact in this market than there are properties available to buy.
How This Compares to Normal
Reliable three-year historical comparison data for Catawissa’s specific market area is not included in this reporting cycle, which limits the ability to make precise year-over-year comparisons. That transparency matters. Any report that invents historical benchmarks to fill that gap would be doing readers a disservice.
What can be said with confidence is that a 1.67-month supply figure is well below what most regional housing markets, including those across Columbia, Montour, and Northumberland counties, have historically sustained during spring months. Spring is traditionally when more inventory enters the market as sellers prepare for the peak buying season. If Catawissa is holding at 1.67 months during what is typically one of the more active inventory periods of the year, that suggests the structural supply constraint here is not a seasonal anomaly. It reflects a longer-term imbalance that has characterized much of Central Pennsylvania’s smaller borough and rural markets over the past several years.
Price growth of 4.6 percent over a single reporting period is also notable. Modest, steady appreciation in the range of two to four percent annually is generally considered healthy and sustainable. A 4.6 percent move in a single period, even if some of that reflects normal seasonal variation, signals that buyer competition remains meaningful enough to push accepted offers above where they were a period ago.
Without the historical baseline, it is not possible to say definitively that this represents the strongest or weakest market Catawissa has seen. What the data does make clear is that conditions are skewed meaningfully toward sellers, and that the gap between available supply and buyer demand is not something that resolves quickly in a small-volume market like this one.
The Story Beneath the Numbers
Small borough markets along the North Branch and Susquehanna corridor tend to behave differently from suburban markets around larger cities. Catawissa, situated in southern Columbia County along Route 487 and accessible to Bloomsburg, the Bloomsburg University employment base, Geisinger facilities in the region, and the broader industrial corridor along Route 11, draws buyers who are often looking for affordability combined with access to services and employment. That combination keeps demand relatively stable even when broader market conditions fluctuate.
When inventory tightens in a market like this, it tightens fast and stays tight. There simply are not enough new construction starts or housing turnover events to meaningfully replenish supply on a short timeline. Older housing stock, estate sales, and occasional relocated sellers represent the primary inventory sources. That structural reality means the 1.67-month figure is unlikely to correct dramatically in a single quarter. It reflects a supply environment that takes years, not months, to shift.
That is the insight worth carrying away from this report. The seller-favorable condition in Catawissa is not primarily a product of unusually aggressive buyer activity or a temporary market spike. It is the product of a constrained housing supply in a small market where inventory does not recover quickly, combined with steady regional demand driven by employment, education, and healthcare anchors in the surrounding area.
What This Means for Buyers
Buyers actively searching in the Catawissa area should expect to find limited choices at any given time. With fewer than two months of supply, new listings may generate attention quickly, and properties priced well relative to comparable sales are unlikely to sit for extended periods before attracting offers.
Buyers should also approach the current list price landscape with clear eyes. The significant gap between the median list price and median sale price in this data set suggests that the active listing pool includes properties priced aspirationally or in categories that do not reflect the typical transaction. Working with an agent who understands local comparables and recent closed sales is particularly important in a low-volume market, where a single outlier listing can distort what the asking price data appears to indicate.
Negotiating leverage for buyers is limited in this environment. That does not mean buyers have no options, but it does mean that approaching well-priced, move-in-ready homes with strong pre-approval documentation and clean offer terms is likely to be more effective than attempting to negotiate aggressively on price.
What This Means for Sellers
Sellers in the Catawissa market are operating from a position of relative strength. Limited inventory means they face less direct competition from other active listings, and the 4.6 percent price increase over the prior period confirms that buyers are willing to meet the market at current values.
That said, the wide gap between median list and median sale prices is a reminder that optimistic pricing does not always translate into results, even in a seller-favorable market. Buyers who have access to recent closed sale data will compare what they are being asked to pay against what homes have actually sold for. Sellers who price within a realistic range of those comps are more likely to move quickly and cleanly. Sellers who price well above current market evidence may find their listings sitting while better-priced alternatives attract the limited buyer pool.
Timing remains favorable. Low inventory and upward price momentum during the spring market represent conditions most sellers would welcome. Sellers who have been considering listing but waiting for the right moment should know that current conditions are supportive.
Putting It Together
Catawissa’s June 2026 market data presents a clear picture once you move past the surface-level numbers. Supply is tight, prices are moving upward, and the market is operating in seller-favorable territory. The median list-to-sale price gap deserves attention not because it signals weakness, but because it illustrates the kind of nuance that raw statistics alone cannot explain. Understanding why that gap exists, and what it actually means for buyers and sellers, is where local market knowledge makes a real difference.
For buyers, the practical reality is limited inventory and competitive conditions. For sellers, the practical reality is meaningful pricing power and a favorable demand environment, provided expectations are grounded in what buyers are actually paying rather than what the highest-priced listings suggest.
The Central