Danville, PA 17821 Real Estate Market Pulse: June 2026
Danville, PA 17821 Real Estate Market Pulse: June 2026
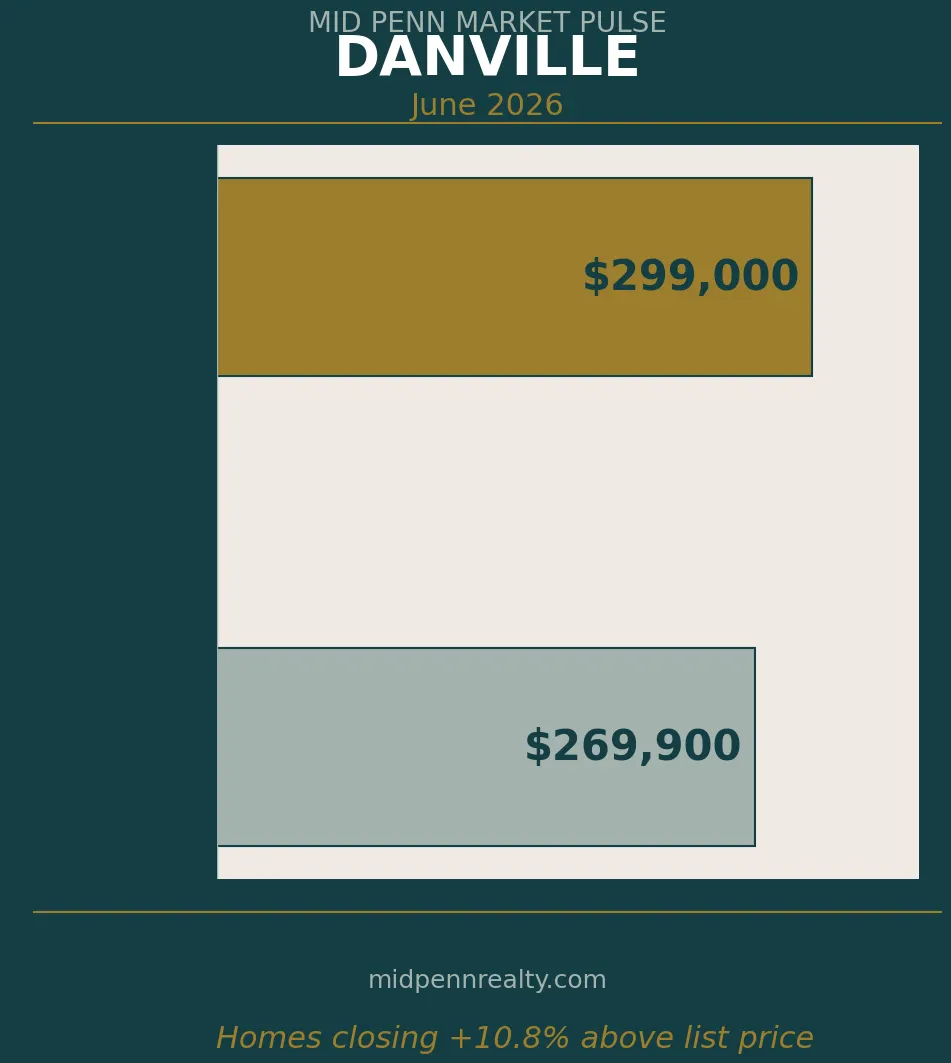
Homes in Danville are selling above their asking price, and the gap between what sellers are listing for and what buyers are actually paying tells a more interesting story than the price increase alone.
The median sale price in the Danville 17821 market reached $299,000 in June 2026, while the median list price sat at $269,900. That $29,000 difference means buyers, on average, are paying roughly 10.8 percent more than what homes are listed for. When you combine that with a list-to-sale ratio of 96.5 percent, the picture becomes clear: buyers are competing for homes, and sellers hold the advantage in negotiations right now.
A 19.1 percent price increase compared to the prior period is a number that demands some explanation. Price jumps of that magnitude do not happen in a vacuum. They reflect a specific combination of conditions, and in Danville’s case, the story begins with supply.
Thirty active listings and two months of supply represent a market that is genuinely constrained. Real estate professionals typically describe a balanced market as somewhere between four and six months of supply. At two months, there are simply not enough homes available to satisfy buyer demand. When buyers are competing for a limited pool of properties, pricing power shifts decisively toward sellers, and the numbers in April confirm exactly that dynamic.
What makes Danville particularly interesting as a market is its position in Montour County as a regional employment and healthcare hub. Geisinger Health System, headquartered here, draws professionals and support staff who need housing within a reasonable commute. The borough itself, situated along the Susquehanna River at the intersection of Routes 11 and 54, serves a broader population that includes buyers from Bloomsburg to the east, Sunbury to the south, and the Milton and Lewisburg corridor to the west. Demand here is not driven solely by local population growth. It is also supported by the consistent employment base that the Geisinger campus and related medical facilities provide.
That context matters when interpreting a 19.1 percent price increase. This is not speculative pricing disconnected from economic reality. It reflects what buyers who need to live within this region are willing to pay when available housing falls short of demand.
The median days on market of 39 days is a metric that deserves careful reading. On its surface, 39 days might suggest a slower market compared to what some communities in Central Pennsylvania were experiencing during the peak competition years of 2021 and 2022, when homes routinely went under contract in days. But 39 days in a market where homes are selling above list price is not a sign of softening. It is a sign of a market that has found a more sustainable rhythm while still favoring sellers. Buyers are taking a few weeks to make their decisions, but when they do commit, they are committing above asking price. That combination points to serious buyers rather than speculative or impulsive offers.
Because detailed historical comparison data for the Danville 17821 market specifically is not available for this reporting period, a precise three-year apples-to-apples comparison cannot be made with confidence. What can be said with confidence is that the current market indicators, taken together, paint a picture that is stronger than what a typical spring market would produce in a smaller Pennsylvania borough with Danville’s characteristics. Two months of supply, a list-to-sale ratio above 96 percent, and a median sale price eclipsing $299,000 in a community where the housing stock includes a healthy mix of modest ranches, Victorian-era homes, and newer construction near the Route 54 corridor suggest conditions that would have been considered remarkably tight even during the competitive markets of recent years. When historical data becomes available for direct comparison, those benchmarks will sharpen this interpretation considerably.
For buyers, the immediate implication is that preparation matters more than timing right now. With only 30 active listings and homes moving despite a month-plus market time, the available inventory turns over with regularity. A buyer who is pre-approved, has identified their priorities clearly, and understands local pricing is in a position to act with confidence. A buyer who is casually browsing and hoping to negotiate a deal below asking price will find this market frustrating. The list-to-sale ratio confirms that sellers are not discounting meaningfully. Offers that come in well below list are unlikely to succeed.
Buyers should also be realistic about selection. Thirty active listings across all price points and property types means that the home checking every box on a list may not currently exist in this ZIP code. Flexibility, whether in terms of cosmetic preferences, lot size, or garage space, often makes the difference between finding a workable home in a reasonable timeframe or waiting months for something that may not appear.
For sellers, June 2026 presents genuine strength. The $29,000 gap between median list and median sale price is not common in most markets. It means buyers are waiving concessions, adjusting their offers upward, and accepting competition as a reality. Sellers who price their homes thoughtfully and present them well are rewarded in this environment. Overpricing, though, carries a risk even in a seller-favorable market. Homes that sit beyond 60 to 90 days tend to attract skepticism, and buyers begin to wonder what the market has already told the seller. Pricing to the market and trusting the current conditions to generate strong offers is a more reliable strategy than reaching for a number and waiting.
Sellers also benefit from relatively low competition right now. Thirty active listings across the entire ZIP code means that a well-presented home does not have to fight through a saturated field to attract attention. The homes that are available stand out.
The broader takeaway from June 2026 in Danville is that this market is behaving in a way that rewards preparation and local knowledge. The price increase of 19.1 percent is meaningful, but it is the combination of above-list sale prices, constrained inventory, and sustained buyer demand that defines the real story. Prices are not rising because sellers are pushing unrealistic numbers. They are rising because buyers are willing to pay them, and the supply of available homes gives buyers few alternatives.
For a community with Danville’s stability, its regional employment anchor, and its access to the Route 11 and Interstate 80 corridors, that demand is unlikely to evaporate quickly. The households relocating for Geisinger positions, the buyers moving in from higher-cost markets, and the local residents looking to move up or downsize all compete for the same limited pool of homes. That pressure does not resolve itself in a single quarter.
The single most useful thing a buyer or seller can do in this environment is get specific, local, current information before making a decision. Broad market commentary based on national or statewide data does not reflect what is actually happening on Oak Street, Ferry Street, or the residential neighborhoods near the Danville Area School District campuses.
For a more detailed breakdown of current activity in the Danville 17821 market, including pricing trends, inventory movement, and neighborhood-level insights where available, you can request the full Mid Penn Market Pulse report directly at the Mid Penn Realty market report page. The report is available at no cost and is designed to give buyers and sellers the kind of local clarity that makes real decisions easier.