Bloomsburg, PA 17815 Real Estate Market Report | April 2026
Bloomsburg, PA 17815 Real Estate Market Report | April 2026
Buyers in Bloomsburg are paying more than asking price, and sellers are pricing below what the market is willing to bear. That combination tells you nearly everything you need to know about where the 17815 market stands heading into spring 2026.
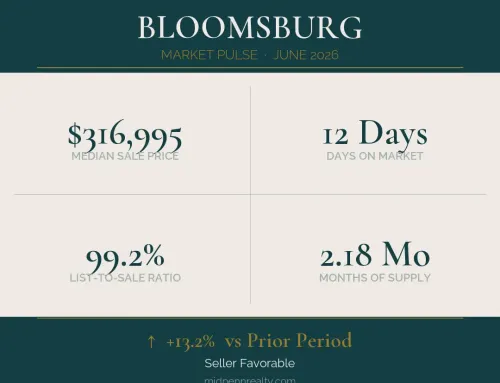
The median sale price in Bloomsburg reached $316,995 in April, while the median list price sat at $287,500. That is not a rounding difference. That is a gap of nearly $30,000 between what sellers are asking and what buyers are ultimately paying. When a market consistently produces that kind of spread, it means demand is outrunning supply in a meaningful way, and buyers who enter expecting room to negotiate are often finding the opposite.
That observation deserves some context before going further. A list-to-sale ratio of 99.2 percent suggests that most homes are selling very close to, or slightly above, their asking price. When you pair that with the fact that the median sale price already exceeds the median list price by a significant margin, what you are likely seeing is a combination of homes that were underpriced relative to market conditions, homes that received competing offers and settled above asking, and a buyer pool that is active enough to push values upward in a compressed timeframe.
Homes in the Bloomsburg market are going under agreement in a median of 12 days. For a community that includes Bloomsburg University students, faculty, regional healthcare employment through Geisinger and other area providers, and a downtown corridor that has maintained steady commercial and residential interest, that pace reflects genuine demand. Twelve days is not a market where buyers can take a weekend to think things over. Properties that are priced appropriately and presented well are finding buyers quickly.
The inventory picture adds additional weight to this reading. Active listings stand at 37 for the reporting period, with a months-of-supply figure of 2.18. In real estate, a balanced market is typically described as having somewhere between four and six months of supply. Anything below that threshold generally favors sellers. At 2.18 months, Bloomsburg is operating well below that threshold, which means buyers are competing for a relatively small pool of available homes.
Because historical comparison data for Bloomsburg at this specific period is not available in this report cycle, it is not possible to say with precision whether 37 active listings represents an improvement or a further decline from prior years. What the current metrics do suggest, without that historical baseline, is that the market is structurally constrained. A months-of-supply figure below 2.5 and a days-on-market figure of 12 days are both indicators of a market where supply is not keeping pace with buyer activity. If prior reporting periods are made available, that comparison will sharpen the picture considerably.
What historical context would add here is the ability to say whether this inventory shortage is new, whether it has been building over the past two or three years, or whether the market is in the early stages of loosening. Those are meaningful distinctions. A market that has been inventory-constrained for three consecutive years is a different environment than one that tightened recently. Buyers and sellers make different decisions depending on which situation they are in, and that kind of trend data is part of what the full Mid Penn Market Pulse report is designed to provide over time.
The 13.2 percent price appreciation compared to the prior period is the headline number, but the context around it matters as much as the figure itself. Price increases of that magnitude in a short window do not typically emerge from modest, steady demand. They tend to appear when buyer activity is concentrated, inventory is limited, and sellers hold meaningful leverage. All three of those conditions appear present in Bloomsburg right now. The more important question is whether that rate of appreciation reflects sustainable market conditions or a temporary compression that will normalize as additional homes enter the market.
There is a counterintuitive dynamic worth noting here. The market condition is described as balanced-favorable, which is a more measured characterization than the raw numbers might initially suggest. Balanced-favorable means the market is tilted toward sellers but has not crossed into the kind of extreme conditions where buyers are consistently shut out. A list-to-sale ratio of 99.2 percent, rather than 103 or 105 percent, reinforces that framing. Buyers are paying full price or very close to it, but they are not being asked to absorb enormous premiums just to compete. That distinction matters when buyers are trying to plan their financing and sellers are calibrating their expectations.
For buyers approaching Bloomsburg in the current market, the practical reality is this: financing should be fully in order before viewing homes seriously. With a median days on market of 12, the window between a new listing appearing and an accepted offer closing is short. That does not mean every home sells in the first few days, but it does mean that being unprepared when the right property appears is a meaningful risk. Buyers who need time to arrange pre-approval after finding a home they want are likely to find themselves behind others who were already ready to move.
Selection at this inventory level is also a real consideration. With 37 active listings across the market, buyers may not find a wide range of options within a specific price band or property type at any given moment. Working with a local agent who can identify properties before they hit the broader market, or who understands which properties may become available before they are formally listed, can matter more than it would in a market with six months of inventory.
For sellers, the April data is straightforward: buyer demand in Bloomsburg is currently absorbing available inventory faster than new supply is entering the market. The median sale price of $316,995 and the list-to-sale ratio of 99.2 percent together indicate that accurately priced homes are finding willing buyers without extended market exposure. Sellers who enter the market this spring with realistic pricing based on current comparable sales are in a favorable position.
What sellers should avoid is overreading the 13.2 percent price increase as license to price aggressively above market. The list-to-sale ratio, while healthy, suggests that buyers are not reflexively offering above the listed price on every property. Homes that are priced well are selling well. Homes that are priced at the outer edge of market tolerance may take longer, which in this environment is a relative statement, but the distinction between a tight market and an overpriced home is one that still matters.
The broader story in the Bloomsburg market this April is one of a community where housing demand is real and consistent. Bloomsburg has characteristics that support steady residential interest regardless of broader national market swings. The university brings a population base that cycles through housing regularly. Regional employment in healthcare and state government provides stability. The Route 11 corridor and proximity to Interstate 80 connect Bloomsburg to Danville, Berwick, and larger employment centers in a way that makes it a practical choice for commuters across Columbia County and beyond.
That demand does not appear to be softening based on the April data. What the market would benefit from, both for buyers who want more selection and for the overall health of the local housing stock, is additional inventory. Whether that comes from new construction activity, from longer-term homeowners deciding the current price environment makes this a reasonable moment to sell, or from some other source, more supply would provide balance that buyers are currently not experiencing.
The full Mid Penn Market Pulse report for Bloomsburg and surrounding Columbia County communities provides deeper trend data over time, including how current conditions stack up against prior years and what regional movement looks like across adjacent markets. If you want to see how this April compares to the same period in recent years, or how the Bloomsburg market fits into the broader Central Pennsylvania picture, you can sign up for the complete report through Mid Penn Realty’s market report portal.
The numbers tell one part of the story. The interpretation is what actually helps you make a decision.