Mifflinburg, PA 17844 Real Estate Market Report | June 2026
Mifflinburg, PA 17844 Real Estate Market Report | June 2026
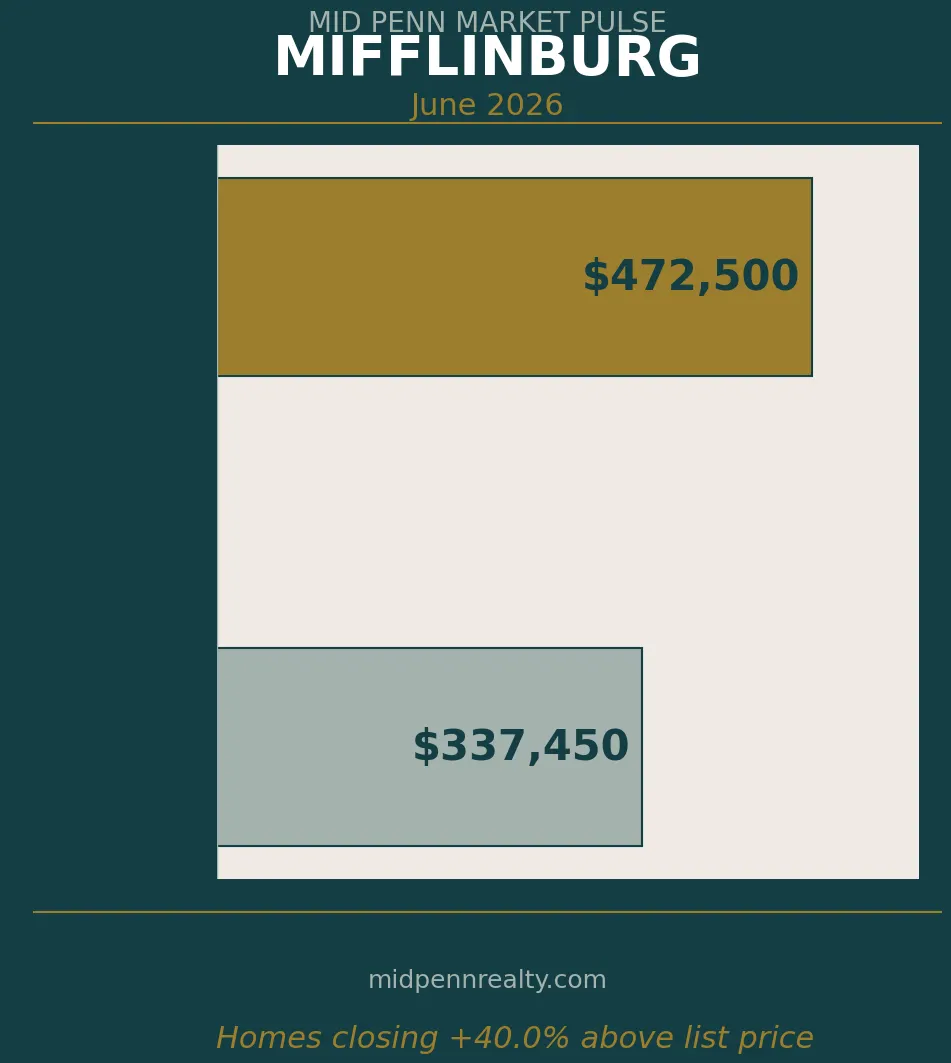
The most striking detail in Mifflinburg’s June 2026 market data is not the price trend or the inventory count. It is the gap between what sellers are listing homes for and what buyers are actually paying. The median list price sits at $337,450 while the median sale price reached $472,500. That is not a rounding difference or a data quirk. It is a signal worth paying close attention to, and understanding what is driving it tells you more about this market than any single statistic could on its own.
Mifflinburg, the county seat of Union County, draws buyers for reasons that go beyond square footage and lot size. The borough’s walkable downtown along Chestnut Street, the proximity to Bucknell University in Lewisburg just a few miles east, and the quieter pace of life in this part of the Susquehanna Valley all factor into the demand side of the equation here. When inventory is constrained, those qualities do not become less appealing. If anything, they concentrate demand on a limited number of available properties.
With only 12 active listings across the market and 2.4 months of supply, the inventory picture in Mifflinburg remains thin by any reasonable measure. A market sitting between four and six months of supply is generally considered balanced, meaning neither buyers nor sellers hold a significant structural advantage. At 2.4 months, Mifflinburg is operating at roughly half of that threshold. The classification as seller-favorable in the current data reflects that reality directly. When fewer homes are available than buyers need, the competition for the right property tends to push outcomes in the seller’s direction regardless of broader economic conditions.
The list-to-sale ratio of 97.9 percent confirms that sellers are not losing significant ground at the negotiating table. A ratio that close to full asking price suggests buyers are not in a position to negotiate aggressively. In a market where only a handful of homes are available at any given time, a buyer who pushes too hard on price risks watching the property sell to someone else. That dynamic tends to keep sale prices anchored close to, and in this case well above, what properties are listed for.
That brings us back to the gap between median list price and median sale price. When sale prices substantially exceed list prices at the median level, it typically reflects one of two conditions, sometimes both. Either a segment of the active inventory is being priced conservatively relative to actual market demand, or buyers in competition are bidding properties up past their asking prices. With 12 active listings and a days on market of 32, there is enough transaction activity to suggest this is not an anomaly from a single outlier sale. The pattern points toward a subset of properties generating enough interest to push final prices meaningfully higher than where sellers started.
The 32-day median days on market is worth contextualizing carefully. Without historical comparison data specific to this area and time of year, it is difficult to say definitively whether that pace is faster or slower than what Mifflinburg has historically seen in April. Obtaining that local baseline would sharpen the interpretation considerably, and it is one of the reasons tracking this market over multiple reporting periods matters. What can be said is that 32 days in a market with only 12 active listings is not a sign of stagnant demand. Homes that sit longer in low-inventory markets typically reflect pricing that needs adjustment or condition factors, not a lack of interested buyers.
The 7.3 percent price decline compared to the prior period is the one figure that requires the most careful reading. A price decrease of that size looks significant in isolation, but in a market where the median sale price still came in at $472,500, the prior period figure would have been in the $510,000 range. Whether that prior period represented an outlier spike or a genuine trend shift is the key interpretive question, and without rolling historical data to anchor the comparison, drawing firm conclusions about direction would be premature. What the current data does show is that even after that adjustment, prices remain well above the median list price, which suggests underlying demand has not evaporated. The decline may reflect a normalization from an unusually strong prior period rather than a deteriorating market.
This is precisely where historical comparison data would provide the most value. Knowing whether April typically produces median sale prices in the $300,000 range, the $400,000 range, or higher for this specific ZIP code would clarify whether current pricing is elevated relative to seasonal norms, depressed, or right in line with what the market typically produces this time of year. That context is something a standard statistics report cannot provide without the historical baseline attached.
For buyers considering Mifflinburg in the current environment, the practical reality is that this is not a market that rewards hesitation. With 12 active listings and sale prices coming in close to or above asking, buyers need to be prepared before they start looking. Pre-approval should be in place. Priorities should be clear. And expectations around negotiating significant discounts off asking price should be realistic. A 97.9 percent list-to-sale ratio means the average seller is yielding less than $7,100 on a $337,450 asking price, and in cases where competition develops, that number compresses further.
Buyers do have more time to evaluate properties than they would in a market where homes were selling in seven to ten days. Thirty-two days is a measured pace that allows for due diligence. But measured pace in a low-inventory environment does not mean low competition. It means the right homes are drawing sustained interest rather than frenzied weekend bidding wars. That is a meaningful distinction.
For sellers, the current conditions carry genuine strength. Limited supply, a list-to-sale ratio near par, and sale prices running well above median list prices all point toward a market that rewards well-prepared sellers. Pricing accurately and presenting the home well matters, but the structural advantage of a 2.4-month supply environment means sellers are not negotiating from weakness.
The 7.3 percent price adjustment from the prior period is worth monitoring, but a single period’s movement does not define a trend. Sellers who have been tracking their equity position over the past several years are likely sitting on meaningful appreciation regardless of near-term fluctuations. The more relevant question for most sellers is not whether prices are down from last month but whether today’s conditions support their goals, and in Mifflinburg’s current market, the answer for most motivated sellers is yes.
The larger story this report tells is about structural imbalance. When supply runs at half of what a balanced market requires, price pressures and competitive dynamics tend to favor sellers even when broader economic headwinds exist. Mifflinburg is a small market by volume, which means individual transactions can move median figures significantly in either direction. That makes it all the more important to look at the full constellation of data rather than isolating any single number.
The combination of a near-full list-to-sale ratio, a sale price meaningfully above list price at the median, and supply well below equilibrium levels tells a consistent story. Demand is present. Inventory is constrained. Buyers are paying close to or above what sellers are asking. That combination does not describe a market in retreat. It describes a market that is working, just with less selection than most buyers would prefer and less breathing room than most buyers would want.
If you want to track how Mifflinburg’s market evolves over the coming months and build that historical baseline that puts current conditions in proper context, the full Mid Penn Market Pulse report for the Mifflinburg area is available through Mid Penn Realty. You can sign up to receive ongoing market data and analysis directly at the Mid Penn Market Pulse report page. Understanding where this market has been is the clearest path to making confident decisions about where it is going.