Selinsgrove, PA 17870 Real Estate Market Report | June 2026
Selinsgrove, PA 17870 Real Estate Market Report | June 2026
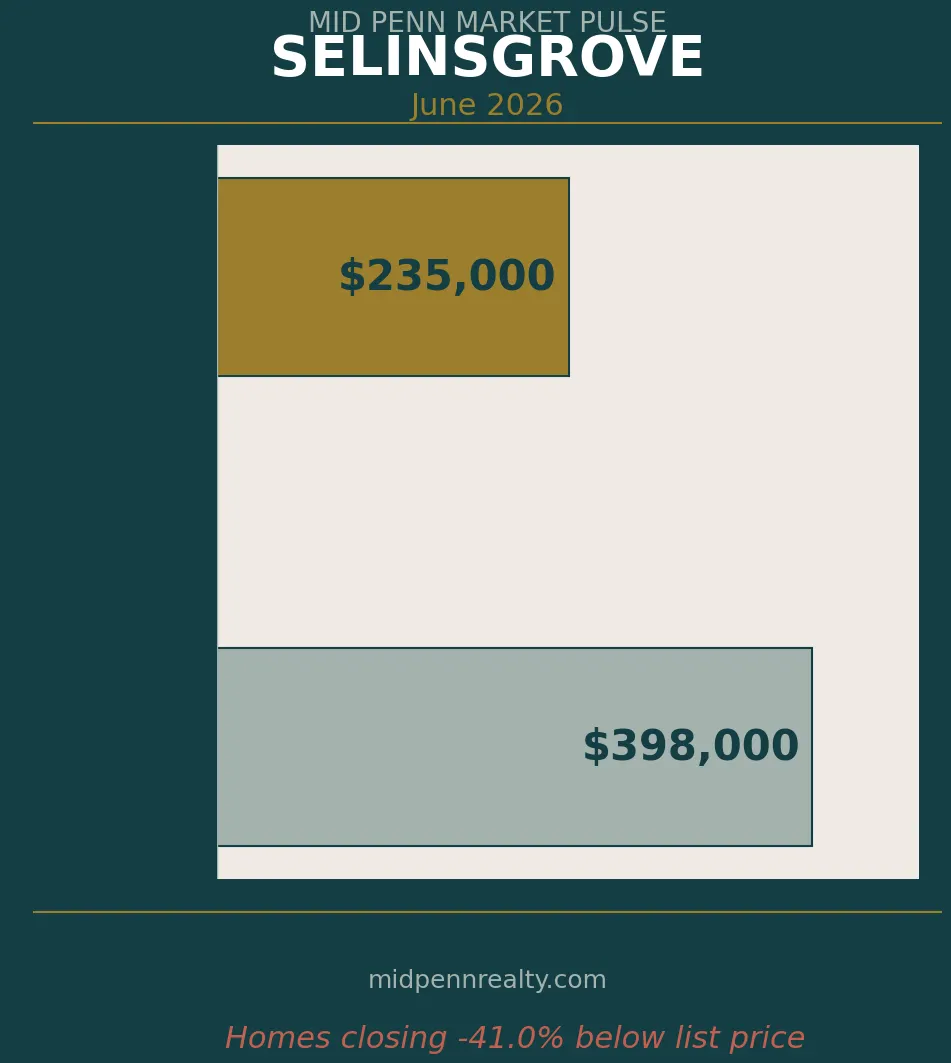
The most telling detail in Selinsgrove’s June 2026 market data is not the price increase. It is the gap between what sellers are asking and what buyers are actually paying.
The median list price sits at $398,000. The median sale price is $235,000. That is a significant spread, and understanding what it means requires looking beyond the surface numbers. In most cases, a gap this wide reflects a market where a portion of the active listing inventory is priced above what buyers are willing or able to pay, while the homes that are actually moving are doing so in a more modest price range. The properties that are selling are selling well. The properties that are not selling may be sitting because the price is ahead of where the market is today.
That distinction matters enormously for anyone thinking about buying or selling in Snyder County’s largest borough right now.
Selinsgrove occupies a distinctive position in Central Pennsylvania real estate. Situated along the Susquehanna River at the intersection of Routes 11 and 15, the borough draws buyers from across Snyder, Union, and Northumberland counties. Susquehanna University anchors much of the local rental and residential demand, and the commercial corridor along Route 11 and 15 supports consistent employment activity. Buyers in Selinsgrove are not just buying a home. They are buying proximity to a university town, to regional healthcare, and to the growing commercial activity along one of Central Pennsylvania’s most traveled north-south corridors.
With that context in mind, here is what the June 2026 data is actually showing.
Homes that are selling are moving in a median of 18 days. That is a pace that reflects motivated, qualified buyers. When a home is priced correctly for the Selinsgrove market, it is not sitting. It is finding a buyer within roughly two to three weeks, which is meaningfully faster than you might expect for a small borough market in Central Pennsylvania. Without three full years of local historical data for this specific period, it is difficult to pinpoint whether 18 days is faster or slower than the Selinsgrove norm, but the broader regional context for similar communities suggests this pace is on the quicker end of what would be considered typical.
The list-to-sale ratio of 97.8 percent supports that interpretation. Buyers in Selinsgrove are paying very close to what sellers are asking, at least for the homes that are transacting. That ratio suggests there is not much room for buyers to negotiate a significant discount on homes that are priced in line with where buyers are positioned. A seller pricing a home accurately in this market should expect to receive close to their asking price. A buyer hoping to come in well under asking price on a correctly priced property may find that approach difficult to sustain.
The months of supply reading of 3.63 is worth discussing in context. A balanced market generally falls between four and six months of supply. At 3.63 months, Selinsgrove is technically sitting on the seller-favorable side of that range, though not in the deeply constrained territory that characterized so many Central Pennsylvania markets during 2021 and 2022. There are 29 active listings in the market, which provides buyers with some options but does not represent the kind of broad selection that tilts negotiating leverage heavily in the buyer’s direction.
To put it plainly: there is enough inventory that buyers are not scrambling, but not so much inventory that sellers are worried. The market is competitive without being chaotic, which is actually a reasonably healthy place for both sides of a transaction to operate.
The 6.9 percent price increase compared to the prior period is a meaningful signal. Price appreciation of that magnitude suggests that demand is exceeding supply for the homes that are actually selling. Even in a market where the median list price and median sale price diverge sharply, the fact that closed prices are trending upward points to underlying buyer demand that has not softened. This is worth noting for sellers who may be wondering whether they missed their best window. The data suggests that correctly positioned homes in Selinsgrove are still generating competitive offers and achieving strong pricing.
Without three full years of April-specific historical data for the 17870 ZIP code, it would be irresponsible to assign a precise historical comparison to each data point. What can be said with confidence is that these metrics align with a market that is performing in a seller-favorable manner, and that the combination of rising prices, a sub-20-day median days on market, and a near-100 percent list-to-sale ratio for closed transactions is consistent with genuine buyer demand rather than a market that is simply drifting upward on paper.
The insight that would be easy to miss when looking at these numbers alone is this: the distance between the median list price and the median sale price is not evidence that the market is weak. It is evidence that pricing discipline matters enormously in Selinsgrove right now. Homes priced in the range where buyers are active are selling quickly and close to asking. Homes priced significantly above where buyers are positioned are likely sitting. The market is not confused. Buyers know what they can afford and what the neighborhood supports. The listings that align with buyer expectations are the ones generating the 97.8 percent list-to-sale ratios and the 18-day closings.
For buyers, this market presents a practical challenge. The inventory of 29 active listings gives you enough to look at, but the homes that are priced well are not lingering. If you find a property that fits your needs and is reasonably priced, the 18-day median tells you that waiting a few weeks to decide is likely to cost you the opportunity. Buyers who come in with financing secured and a clear sense of their priorities will be better positioned than those who are still working through the process. Negotiating a large discount on a well-priced home in this market is going to be difficult given the 97.8 percent list-to-sale ratio. Setting realistic expectations about what the negotiating process looks like will save time and frustration.
For sellers, the data offers both encouragement and a clear caution. The encouragement is that buyers are active, prices are rising, and correctly priced homes are finding offers quickly. The caution is that the gap between the median list price and the median sale price is a real signal about where buyers are positioned. Pricing a home significantly above comparable closed sales in hopes of leaving room to negotiate is a strategy that appears to be generating listings that sit rather than sell. The homes achieving the 97.8 percent list-to-sale ratio are the ones priced with the market, not above it.
Selinsgrove’s residential market in June 2026 is functioning as a seller-favorable environment for prepared, appropriately priced listings. The borough’s position along the Routes 11/15 corridor, the presence of Susquehanna University, and the region’s steady employment base continue to support consistent buyer interest. As spring activity builds across Snyder County and the surrounding region, the market dynamic is unlikely to shift dramatically in either direction over the near term, absent a meaningful change in mortgage rates or inventory levels.
The most important question for anyone engaging with this market, whether buying or selling, is not what the statistics show. It is what the statistics mean for your specific situation, your price range, and your timeline. That conversation is worth having with someone who knows this market at the local level.
For a more detailed look at residential market conditions in Selinsgrove and the surrounding communities, the full Mid Penn Market Pulse report is available through our market report signup page, where you can receive ongoing data specific to your area of interest.